Optimize the visibility of real-time AI data processing
Bringing transparency and spatial visibility to the visual data automation process.
Skills
UX/UI Design, SaaS B2B
Sector
Industry, Vision AI
Date
2023/2024

Context
Data Flow is the visual data integration module of the Alteia platform. It automates the process of transforming raw files – images, 3D models – into structured and usable information.
The problem
Opacity of the process
Lack of clear information on the status of data ingestion and processing. Users did not know the progress of their pipeline.
Lack of spatial visualization
Users struggled to understand the precise geographic location of ingested visual data due to the lack of a map interface.
Objectives
Develop a comprehensive monitoring dashboard providing real-time visibility into ingestion processes.
Integrate an interactive 2D mapping interface to visualize and manipulate geospatial data.
Ideation process
Stakeholder Interviews
Close collaboration with the COO, an expert user of the module, to gather firsthand insights and identify critical pain points.
"How Might We" Workshop
Session with the Product Owner to reframe problems as opportunities by brainstorming creative and actionable solutions.
MoSCoW Methodology
Categorizing features into Must-have, Should-have, Could-have, and Won't-have to align efforts with the most critical needs.
Key screens
Overview Tab
A summary view with key metrics (completed, in progress, and error-prone files) in a donut chart format. The second section details each status with direct links to the associated files.

Files Tab
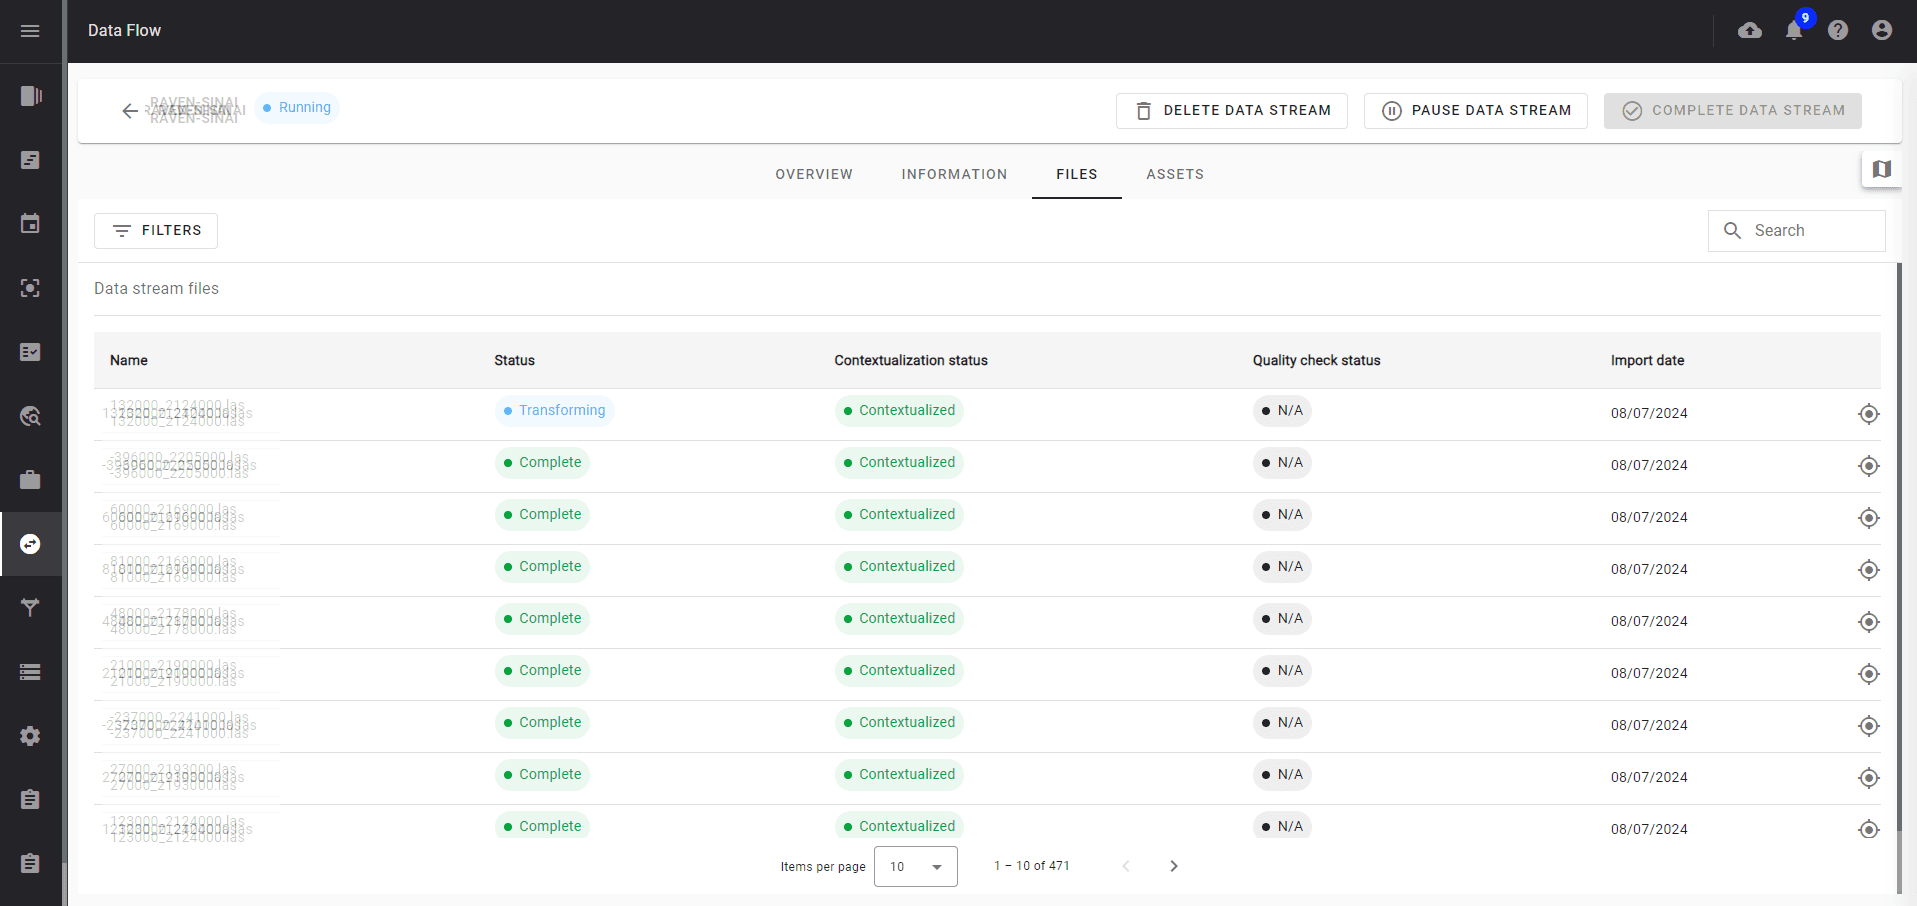
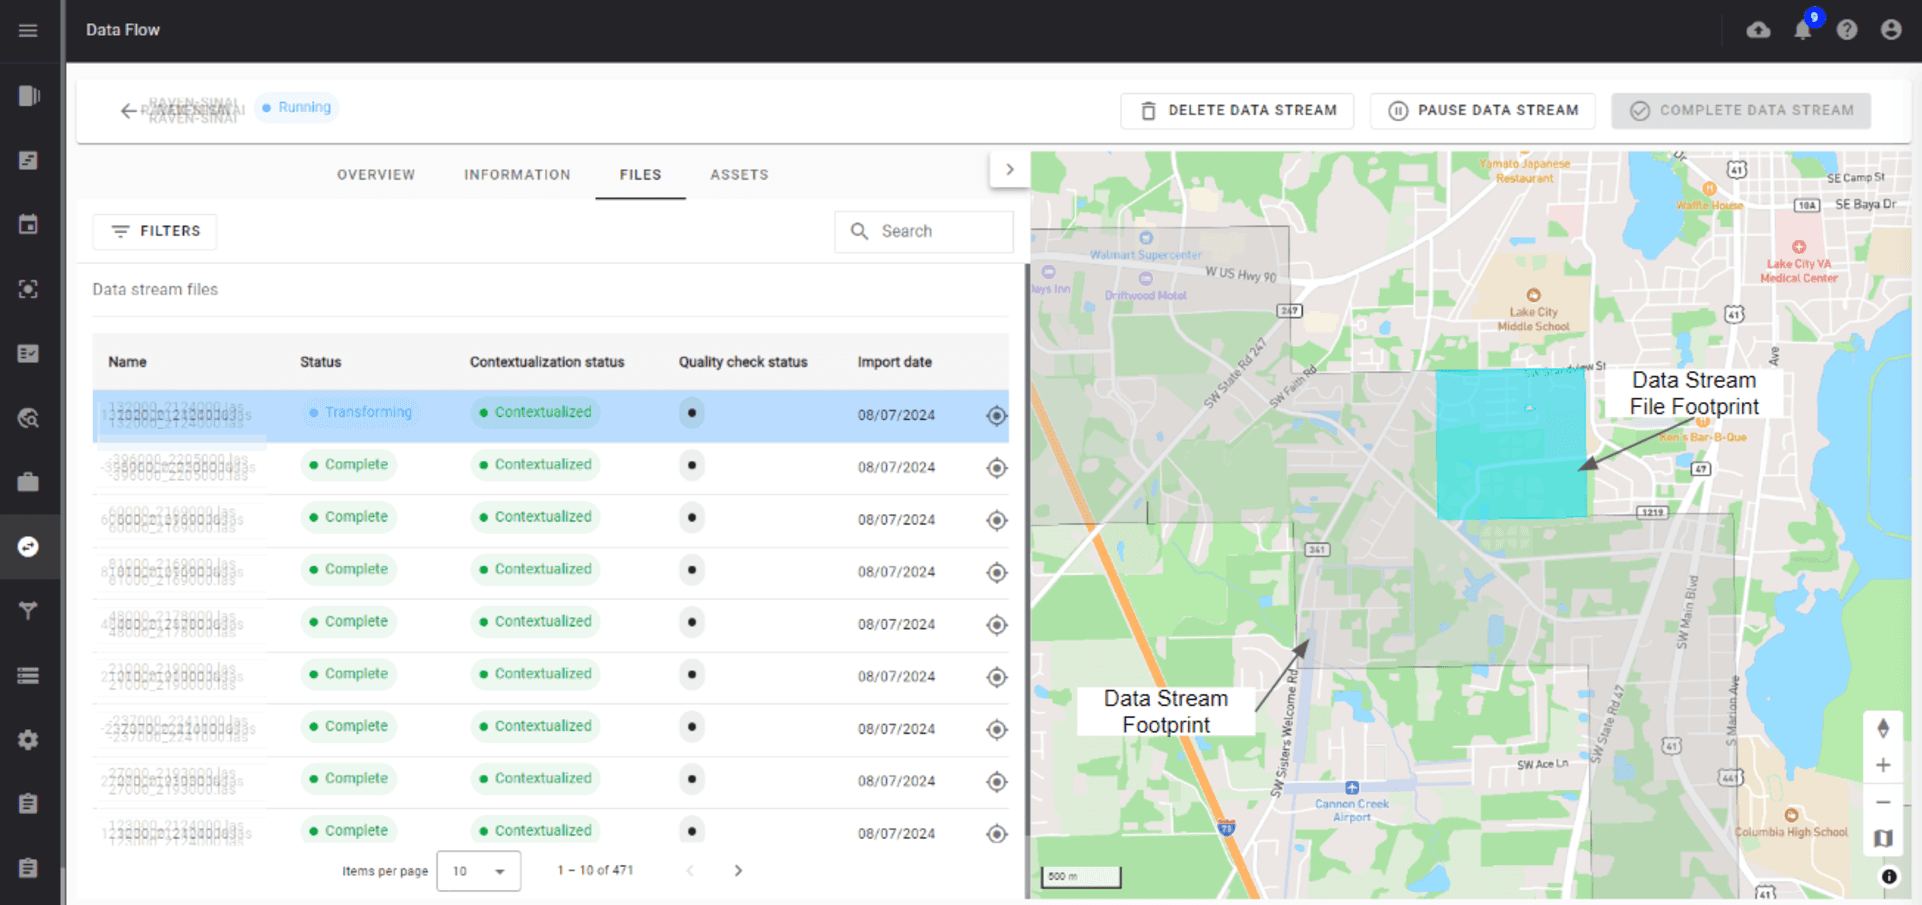
Status tracking for each ingested file (import, contextualization, quality check, export). For geospatial data, the footprint of each file can be viewed directly on the map.
Assets Tab
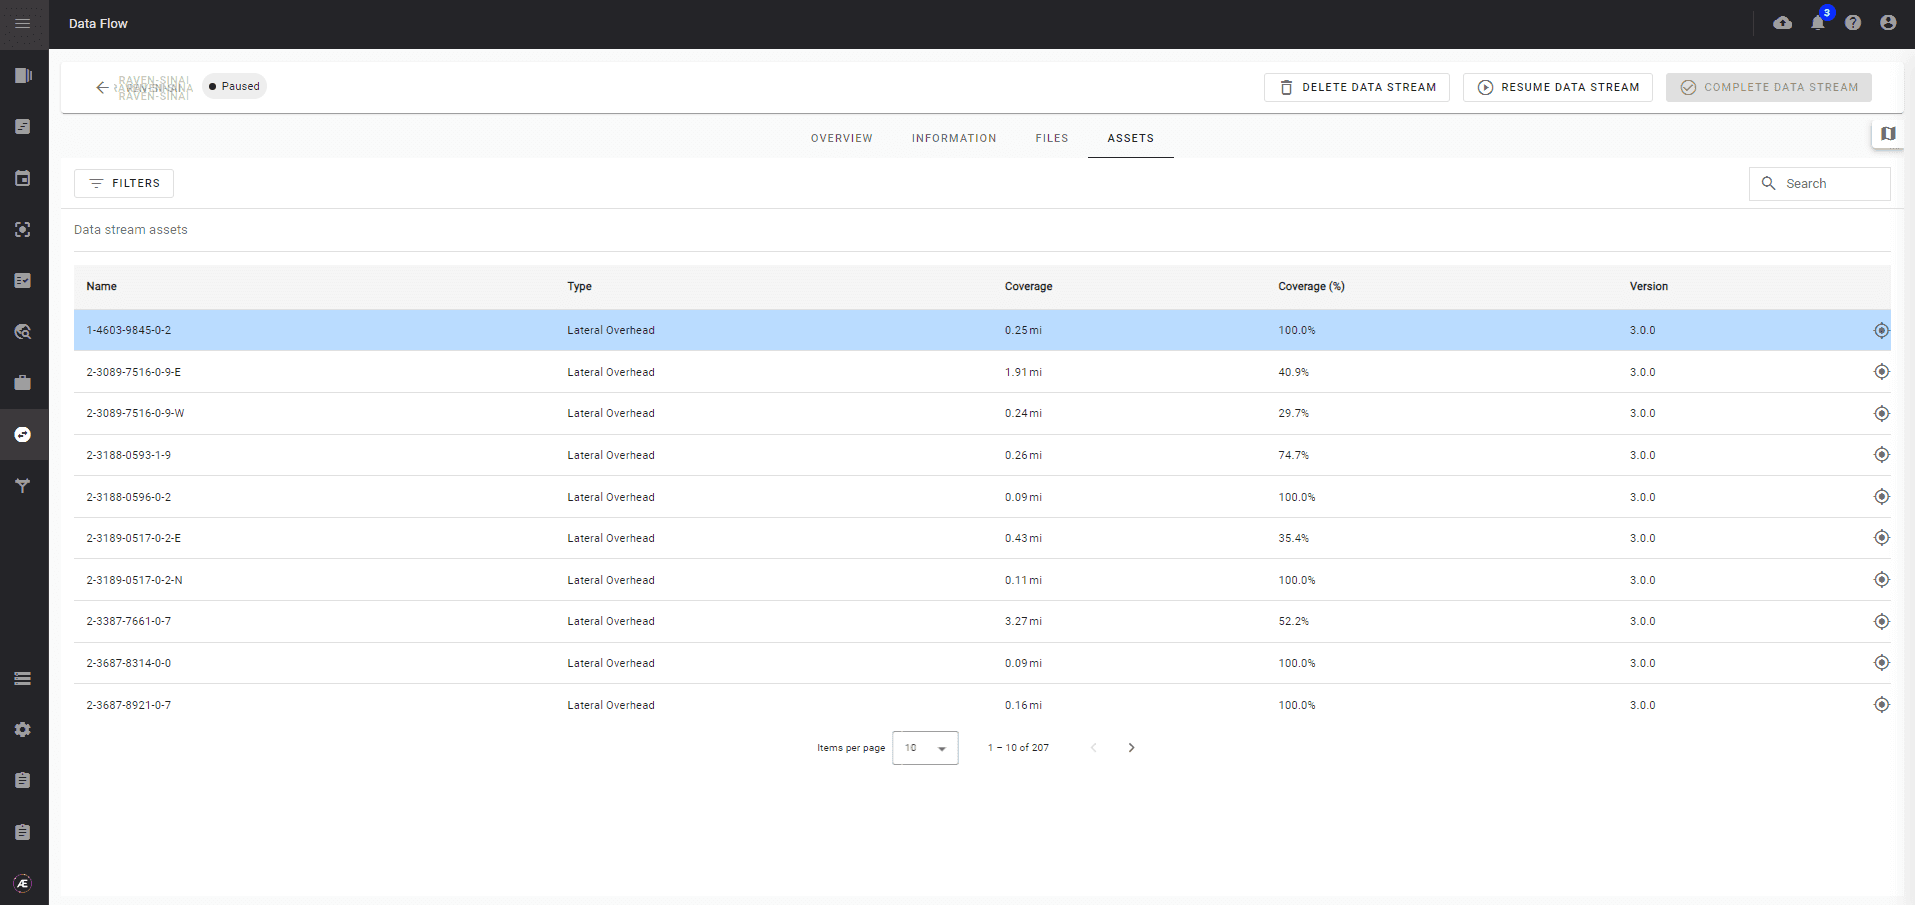
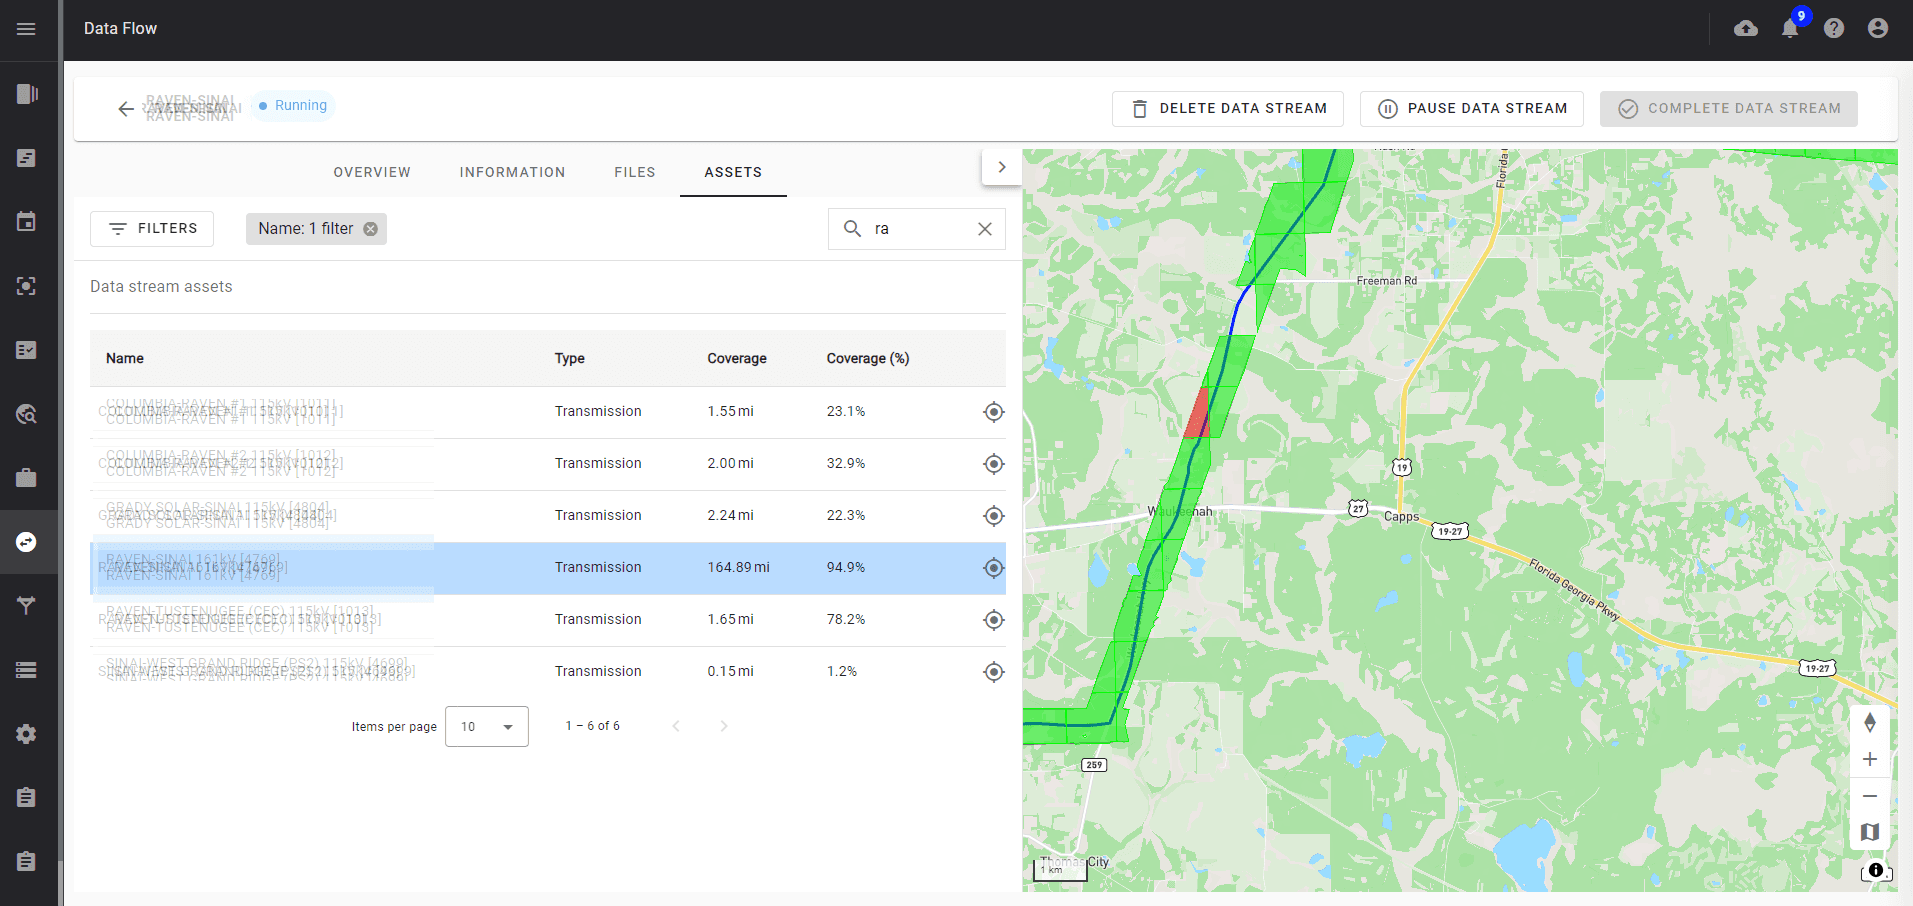
Management of final data processing results: list of resources with coverage, percentage, and version. Visualization of each asset's footprint on the map to understand its geographic scope.
Results
Feedback from stakeholders and users has been overwhelmingly positive, confirming the usefulness and impact of the changes implemented.
Through internal interviews, we were able to demonstrate to C-level executives the crucial importance of involving users in the design process, even when this practice is not yet well established within the company.
Lessons learned
User research is always possible
It is entirely possible to conduct user research with available resources, even when this practice is not yet ingrained in the company culture. Every insight has value.
Involve users from the start
Collaborating directly with the COO - as an expert user - allowed for the rapid structuring of priorities and avoided costly back-and-forth at the end of the project.
Defend the value of design
Presenting the research results to senior management helped solidify the legitimacy of the UX approach within the organization, paving the way for a more mature design culture.
Other projects

Designing a data management module for a SaaS platform
Centralizing complex geospatial data management into a single, intuitive interface.
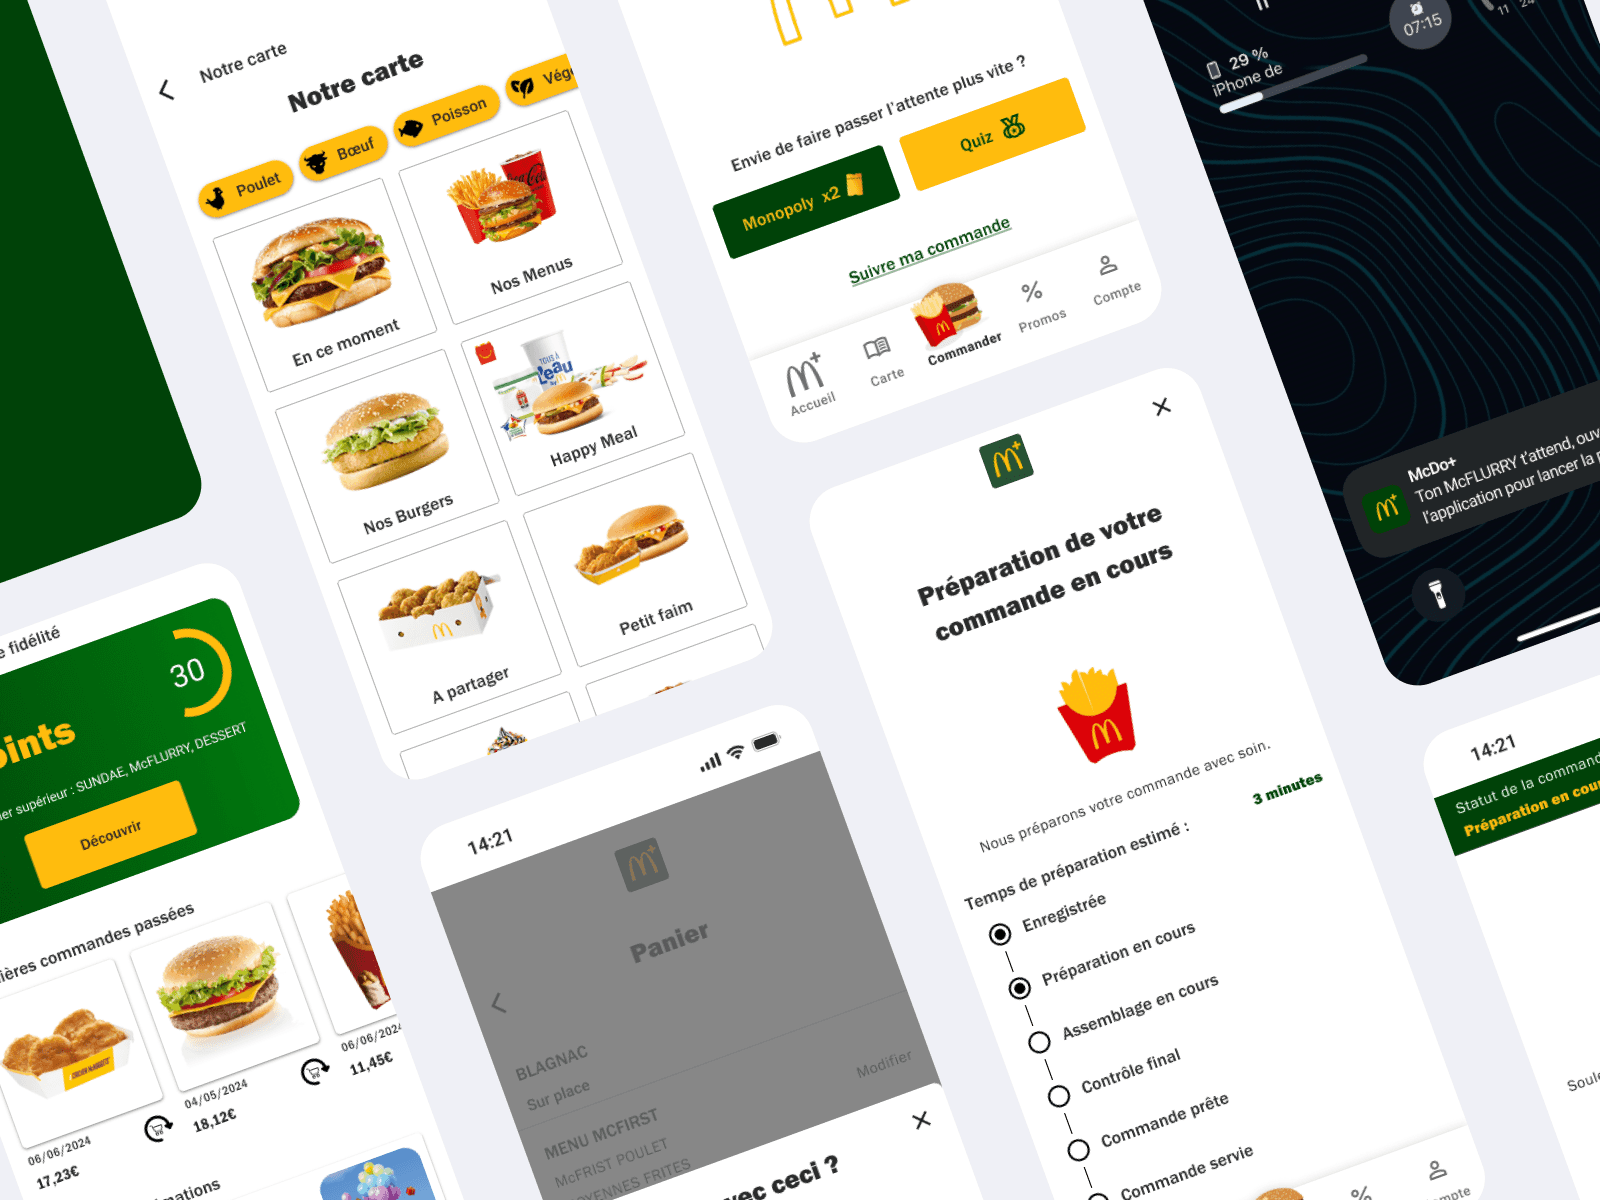
Wait Design: Optimizing the waiting experience at McDonald's
Leveraging UX methods and cognitive science to transform waiting into a pleasant and engaging experience.
See more