Integrating sports into your company with a coaching solution
Case study as part of an application for an apprentice UX Designer position at a company in the sports and health sector.
Skills
UX/UI Design
Sector
Sports & Health
Date
September 2024

Given context
"You are in charge of designing a dashboard for an HR manager and/or a business leader who oversees the implementation of our company's service. This dashboard must present key information in a way that is both comprehensive and concise."
Understanding the users
The main users of this dashboard are HR managers and business leaders. They use this data to make strategic decisions about the service, such as resource allocation, program optimization, and improving employee satisfaction. Therefore, the dashboard must be designed to meet their specific needs for relevant and actionable information.
How I approached this project
Understanding the context and needs: In-depth analysis of the project's objectives, users, and key data.
User research: Data collection to guide the design based on the real needs and expectations of users.
Wireframing and prototyping: Creation of wireframes to define the structure, followed by transformation into a prototype.
Testing and iteration: Conducting user tests to validate the prototype and make necessary modifications.
Objectives and needs
Main objectives
- Propose an intuitive and engaging user interface.
- Highlight key indicators.
- Facilitate data-driven decision-making.
User needs
- Clear and concise visualization of key indicators.
- Interactivity to explore data in depth.
- Easy access to basic information for quick decision-making.
- Data prioritization to highlight what is most important.
Proto-persona


User research
Due to the project deadline, it was not possible to conduct in-depth user research. However, here is how I would have proceeded:
User interviews
- Identifying key users to understand their specific needs.
- Designing an interview guide with open-ended questions to gather information about user expectations, goals, challenges, and preferences.
- Conducting in-person or video interviews to deepen the understanding of their needs and priorities.
Online questionnaires
- Designing the questionnaire with clear and relevant questions to obtain quantitative data.
- Selecting participants by identifying a representative sample of potential users.
- Distributing the questionnaire using online tools to participants and collecting their responses.
Data analysis
- Qualitative analysis: Using information gathered from interviews to identify recurring trends, patterns, and needs.
- Quantitative analysis: Using questionnaire data to quantify participant preferences and opinions.
- Synthesis of results: Synthesizing qualitative and quantitative information to identify priority user needs and opportunities for improvement.
Wireframes
For this design phase, I had no specific instructions regarding the number of pages to create. Therefore, I decided to design 3 pages for the desktop version: one "Overview" page, one "Your Participants" page, and one "Your Sessions" page. For the mobile version, I focused my efforts on the "Overview" page.

Mockups

Mobile version
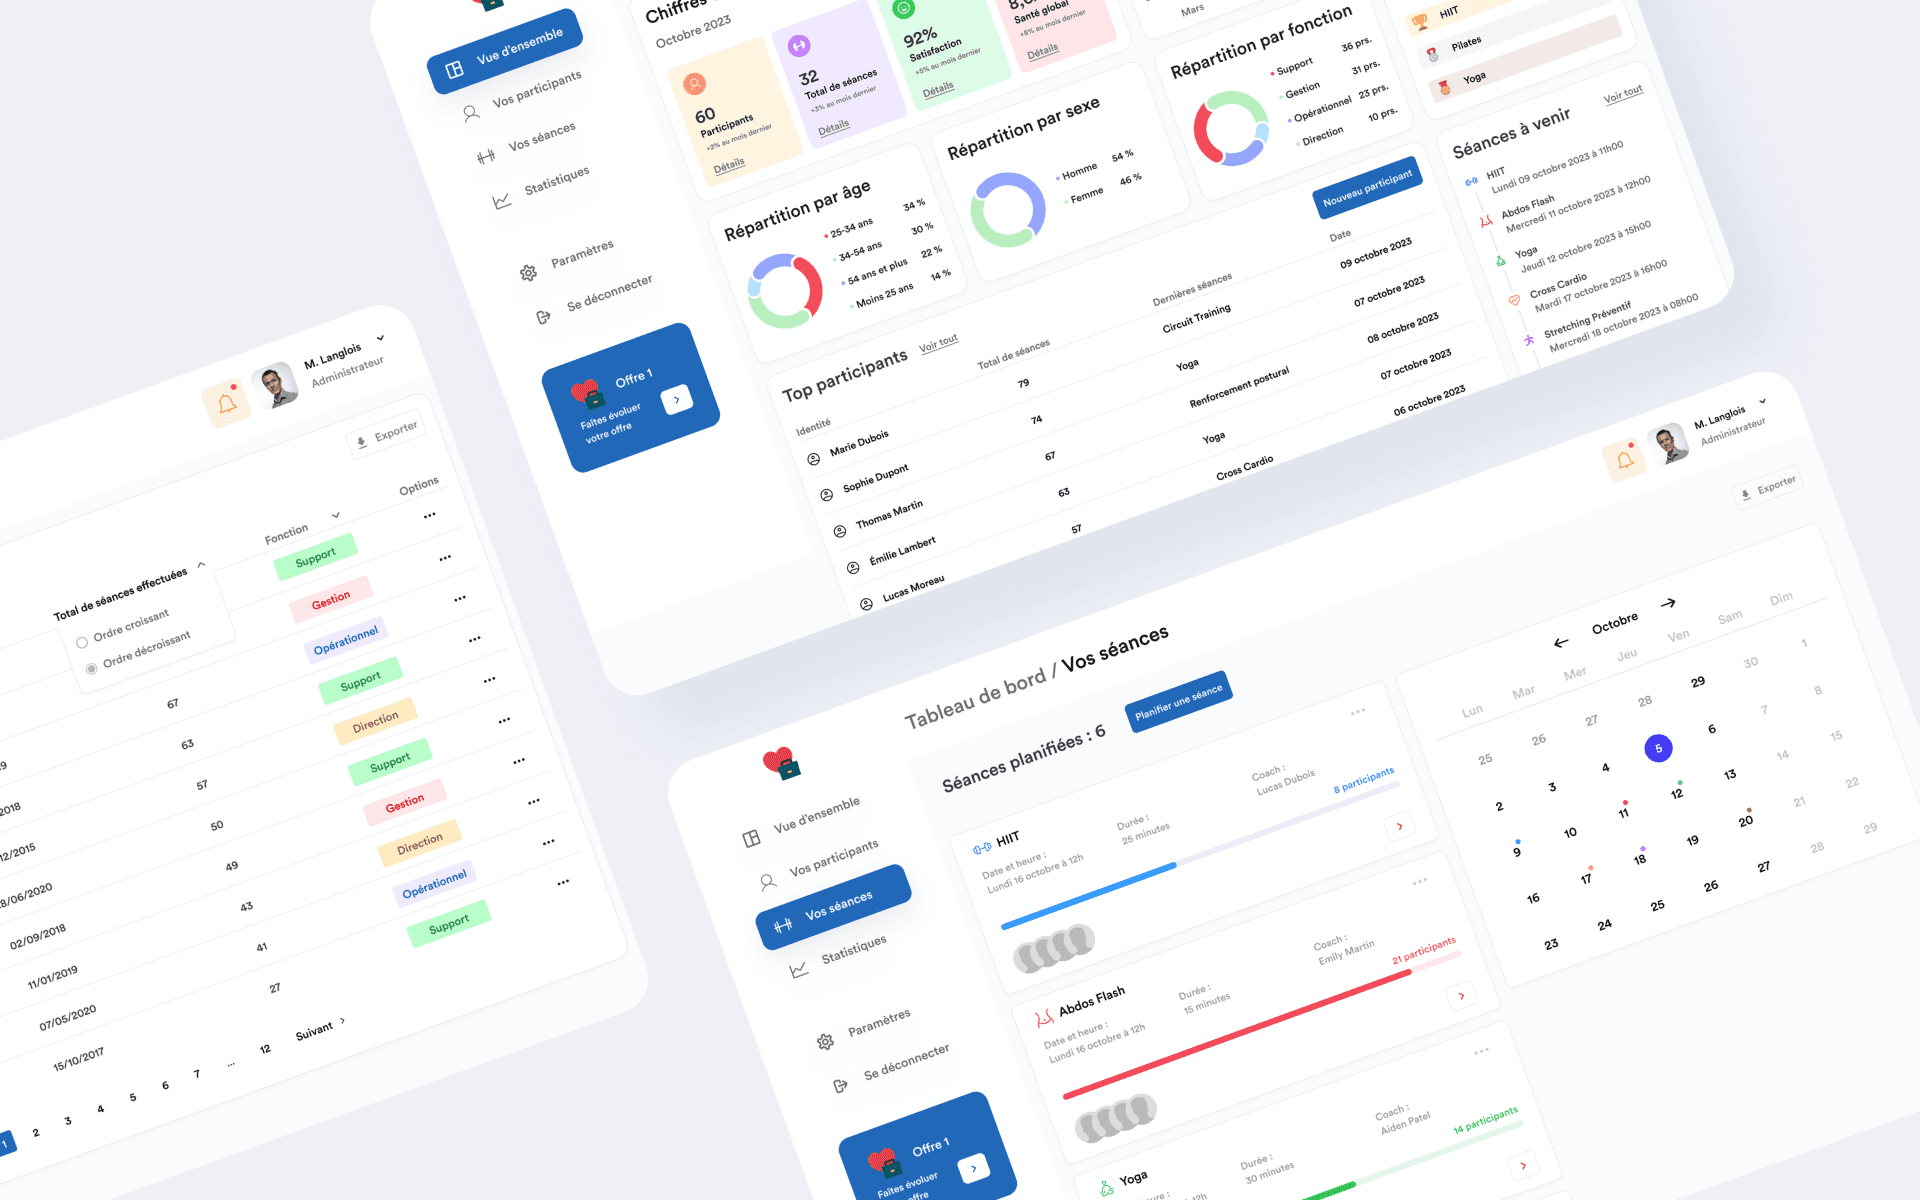
Desktop version
Testing and iteration
Once the dashboard proposal was created, the next step was to ensure an optimal user experience. Due to the project's time constraint, it was not possible to conduct live user tests. However, iteration is at the core of my design principles.

